
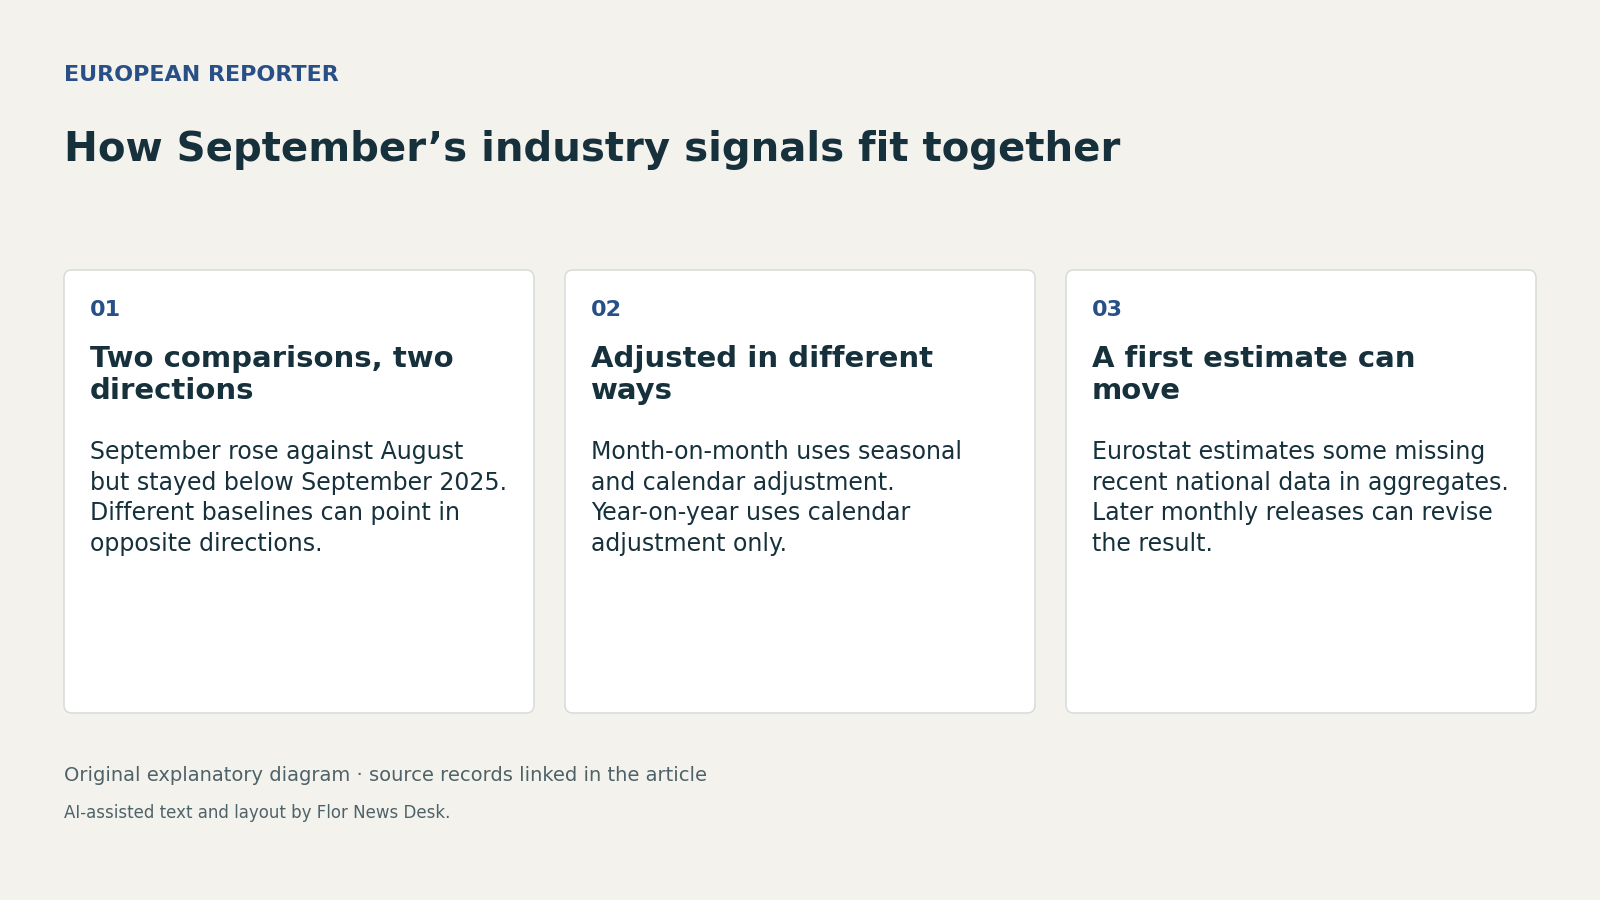
Eurostat’s first estimate for September 2026 left Europe with two true but easily conflated signals: industrial production in the euro area rose 0.2% from August and in the EU 0.5%, yet compared with September 2025 it fell 1.5% and 0.8% respectively (Eurostat release). The apparent contradiction matters because one figure compares consecutive months and the other compares the same month a year apart. Those are different tests, not rival verdicts on the same baseline.
The monthly numbers are built from a seasonally adjusted series, while the annual comparisons are calendar adjusted (Eurostat release; Eurostat STS metadata). That means September’s month-on-month change is intended to strip out recurring seasonal patterns and calendar effects when comparing August with September. The year-on-year change instead asks a narrower question: how did September 2026 compare with September 2025 after adjusting for calendar differences? A small monthly increase can therefore coexist with an annual decline if the level of production, even after rising from August, still remained below where it stood a year earlier.
The release is also about production volume, not turnover, export receipts or profits. Eurostat describes the indicator as measuring the evolution of industrial output volume, excluding construction, for total industry under NACE Rev. 2 sections B to D (Eurostat release). The methodology record adds that the production index is a monthly output-volume measure and is intended to indicate the volume trend in value added over a reference period, which is not the same as publishing actual value-added totals (Eurostat STS metadata). For readers, that rules out a common shortcut: treating this release as a direct readout of industrial sales or broader national-accounts performance.
September’s result is also not a settled endpoint. Eurostat labelled the 16 November 2026 publication a first estimate and said missing recent observations from member states are estimated when it calculates euro-area and EU aggregates (Eurostat release). Its short-term business statistics metadata says these European aggregates are released and revised once per month when new information becomes available (Eurostat STS metadata). The same release shows what that means in practice: August’s monthly rates were unchanged from 15 October 2026, but the EU’s August annual rate was revised to -0.1% from -0.2%, while the euro area stayed at -1.1% (Eurostat release).
That revision risk is one reason not to over-read the country table. The source record here supports the aggregate rates and national rates published by Eurostat, but it does not provide contribution weights or a causal breakdown for why the EU and euro area moved as they did (Eurostat release). Analysis can go one step further than summary: because the aggregate uses estimated missing observations and may be revised, and because the published material does not show contributions, a member state with a sharp change should not be presented from this record alone as the driver of the EU total.
The practical reading of the September release is therefore narrower than either a bullish or gloomy headline suggests. On the published evidence, industrial output volume ticked up from August but remained below its year-earlier level (Eurostat release). Whether that becomes a durable turn cannot be established from one first estimate. Eurostat scheduled the next release for 15 December 2026, and its own methodology says revisions are part of the process as national data are completed and updated (Eurostat release; Eurostat STS metadata).